Introduction
The 16 Types assessment is based on Carl Jung’s Theory of Psychological Types (Jung, 1921), which proposes that there are four primary dimensions among which we can evaluate personality traits. The benefit of the 16 Types assessment is that it broadly covers the most prominent personality traits. This is particularly helpful because personality traits are relatively consistent across time and situation, and can be reliably be connected to observable workplace behaviors.
Cloverleaf uses the Keirsey Temperament Sorter® II (KTS) (Keirsey, 1998), which is based on self-reporting of observable behaviors. Across several studies, external researchers (i.e., unaffiliated with the assessment entity) illustrate construct validity and reliability for the assessment (e.g., Abramson, 2010; Dodd & Bayne, 2007; Kelly & Jugovic, 2001; Quinn et al., 1992; Tucker & Gillespie, 1993; Waskel, 1995). What follows is a construct validity evaluation using Cloverleaf’s 16 Types participants.
The four dimensions of the 16 Types assessment include energy, perception, judgment, and orientation. Each dimension operates along a theoretical continuum with two polar anchors. The energy dimension addresses the degree to which sensory perception is draining (introverted) or energizing (extroverted). The perception dimension addresses the degree to which we process information using micro-level facts and details (sensor) or macro-level abstraction and patterns (intuition). The judgment dimension addresses the degree we place importance on logic-based information (thinker) or values-based information (feeler). The orientation dimension addresses the extent to which we prefer to have a fluid and adaptable approach (perceiver) or an orderly and controlled approach (judger) to our lives.
Respondents are given a series of 70 questions. Each question is specific to one of the four dimensions. For each question, the respondent is asked to select one of two responses. The two response options are representative of each anchor (e.g., introversion versus extroversion, sensor versus intuit, feeler versus thinker, and perceiver versus judger).
The energy dimension has a total of 10 questions, and the remaining three dimensions each have a total of 20 questions. The percentage of the responses representing one anchor or the other dictates their final score for each dimension. The user is then given their type (e.g., INTJ) based upon which of the anchors for each of the four dimensions had the highest percentage.
Sample and Methodology
The sample consisted of 176,424 participants that completed the 16 Types assessment using the Cloverleaf platform. To illustrate construct validity, I employed several techniques. First, I assessed inter-item reliability for each of the four dimensions. Second, I assessed the overall factor structure by conducting confirmatory factor analyses. Third, I assessed convergent and divergent validity by evaluating correlations among related assessment dimensions. Fourth, I assessed test-retest reliability among a subset of users that have taken the assessment multiple times.
Reliability Analyses
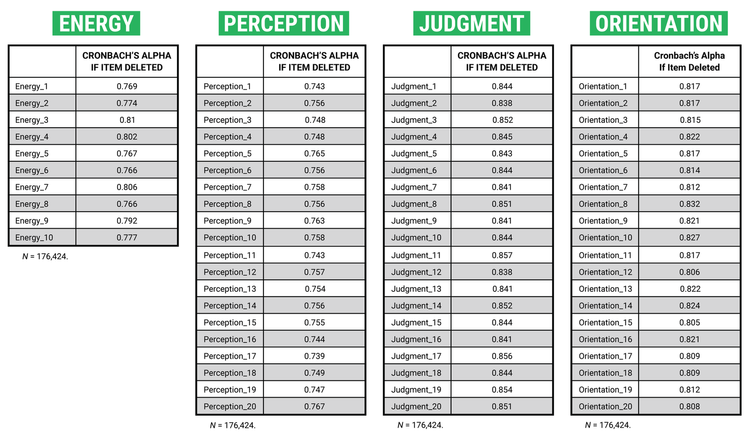
I conducted reliability analyses to evaluate the degree to which the items within the assessment were reliably evaluating the dimensions of interest. Each question offers two options. The first is representative of one endpoint of the continuum (e.g., introverted) and the second is representative of the other endpoint of the continuum (e.g., extroverted). The selections were coded such that the first option was -1 (i.e., introverted, sensor, feeler, and perceiver) and the second option was +1 (extroverted, intuition, thinker, and judger). The 10-item energy dimension (α = .80), the 20-item perception dimension (α = .76), the 20-item judgment dimension (α = .85), and the 20-item orientation dimension (α = .82), all had Cronbach alpha reliabilities above the traditional .70 threshold. Further, the findings illustrated that removal of any one item would not substantially enhance the overall reliability (see Table 1).
Table 1. Reliability Analysis
Factor Analyses
We conducted factor analyses to assess the overall dimensionality of the assessment (see Table 2). Specifically, to investigate whether there is empirical support for the four theoretically derived dimensions, I conducted a forced, four-factor analysis with varimax rotation. Overall, the factor loadings aligned well with the theoretical factor structure.
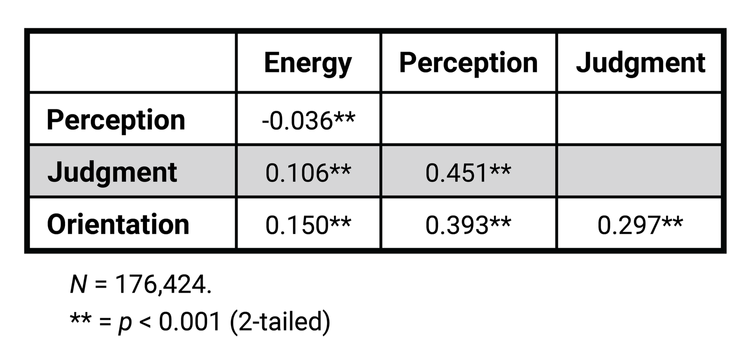
Within the energy dimension, there were no significant cross-loadings. Within the perception dimension, there were four items with cross-loadings on the judgment dimension (i.e., items 10, 12, 13, and 20). Within the judgment dimension, there was one item with a cross-loading on the perception dimension (i.e., item 17). Within the orientation dimension, there were two cross-loading items, one for the perception dimension (i.e., item 13) and one for the judgment dimension (i.e., item 10). In each case, the cross-loadings were relatively minor. Further, in each case, the cross-loadings align with the expected relationships among dimensions. Specifically, correlational analyses illustrate that the perception and judgment dimensions (r = .45, p < .01), the perception and orientation dimensions (r = .39, p < .01), and the judgment and orientation dimensions (r = .30, p < .01), have low to moderate positive associations (see Table 3).
Table 2. Factor Analysis
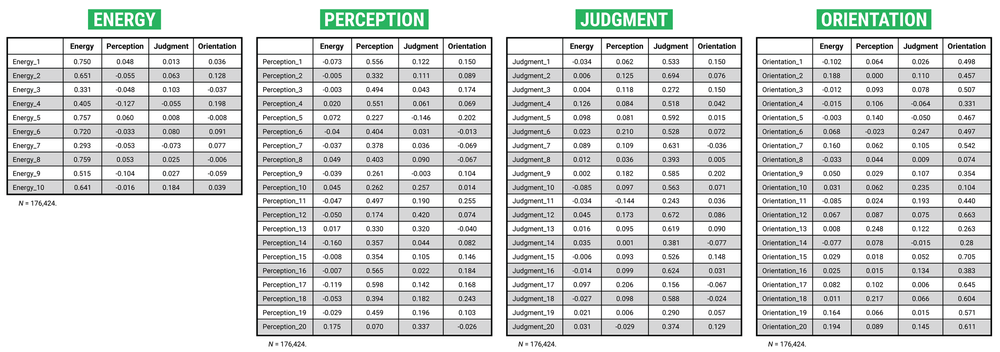
Table 3. Bi-Variate Correlations
Convergent and Divergent Validity
Of the 176,424 participants that completed the 16 Types assessment, 19,466 have completed the DISC personality assessment (Marston, 1928/2013; Merenda & Clarke, 1965), and 8,071 have completed the Instinctive Drive assessment (De Raad & Doddema-Winsemius, 1999; Fitzgerald et al., 2006; Fitzgerald et al., 2011) within the Cloverleaf platform. We conducted correlation analyses within these sub-groups to instigate convergent and divergent validity.
The DISC assesses traits, but with a focus on the approach and outlook one is likely to have when interacting with others. Individuals higher in dominance (D) tend to be confident, blunt, demanding, and task-focused. Individuals higher in influence (I) tend to be enthusiastic, persuasive, optimistic, and relationship-focused. Individuals higher in steadiness (S) tend to be calm, deliberate, loyal, and dependable. Individuals higher in conscientiousness (C) tend to be independent, competent, and detail-focused.
The Instinctive Drives assessment evaluates individuals’ innate behavioral tendencies. Instincts are similar to traits in that they dictate specific sets of behaviors. However, instincts also address why such behaviors are preferred (i.e., what drives the behavior). The assessment determines whether respondents prefer to “use” or “avoid” four instinctive drives: verify, authenticate, complete, and improvise. Individuals that use verify need clarity and are driven to “get it right.” Individuals that use authenticate need open and direct communication and are driven to see tangible results. Individuals that use complete need time to focus and are driven to make progress. Individuals that use improvise need to create and interact with others and are driven to make things possible.
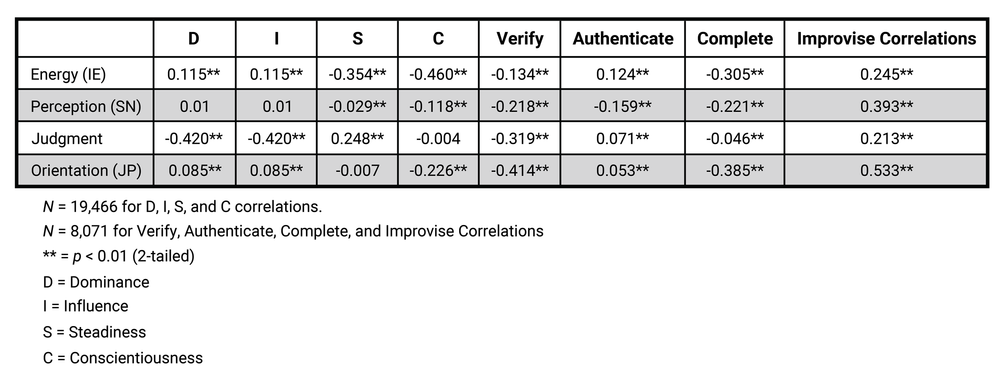
Extroverts are more socially driven than their introverted counterparts. As expected, the findings illustrate that extroversion (higher on energy dimension) was strongly associated with influence (r = .647, p < .01), authenticate (r = .124, p < .01), and improvise (r = .245, p < .01), all of which involve more communicative and relational tendencies. Alternatively, introverts prefer deep-thinking activities that can be done in solitude. Along those lines, introversion (lower on energy dimension) was associated with steadiness (r = -.354, p < .01), conscientiousness (r = -.460, p < .01), verify (r = -.134, p < .01), and complete (r = -.460, p < .01), all of which entail task-focused tendencies.
Intuits notice patterns, focus on the big picture, and are forward-looking. As expected, I found that intuition (higher on perception dimension) was associated with improvise (r = -.393, p < .01), which also entails seeing and pursuing opportunities. Alternatively, sensors focus on facts and details. Along those lines, we found that sensor (lower on perception) was associated with conscientiousness (r = -.118, p < .01), verify (r = -.218, p < .01), authenticate (r = -.159, p < .01), and complete (r = -.221, p < .01), all of which entail the same focus on finding and applying evidence to decision-making.
Feelers tend to be warm and compassionate. The findings support this direction, illustrating that feeler (higher on judgement) is associated with influence (r = .271, p < .01) and steadiness (r = .248 p < .01), which entail being interested in and kind towards others. Alternatively, thinkers tend to focus on logic and seeking the truth. The findings support this direction, illustrating that thinker (lower on judgment) is associated with verify (r = -.319, p < .01), which is also about seeking out the truth through facts. This need for truth and logic can also come across as lacking compassion or empathy, which aligns with findings illustrating that thinking is associated with dominance (r = -.420, p < .01), which can come across as being blunt.
Perceivers like to keep things open-ended. The findings support this direction, illustrating that perceiver (higher on orientation) is positively associated with influence (r = .159, p < .01) and improvise (r = .533, p < .01), which both entail a capacity to be more adaptable. Alternatively, judgers like order and process. Along those lines, the findings illustrate that judger (lower on orientation) is associated with conscientiousness (r = -.226, p < .01), verify (r = -.414, p < .01), and complete (r = .385, p < .01), all of which entail being steadfast in keeping things organized and under control.
Table 4. Bi-Variate Correlations with Related Constructs
Test-Retest Reliability
References
Keirsey, D. (1998). Please understand me II: Temperament, character, intelligence. Prometheus Nemesis Book Company.
Abramson, N. R. (2010). Internal reliability of the Keirsey Temperament Sorter® II: Cross-national application to American, Canadian, and Korean samples. Journal of Psychological Type, 70(2), 19–30.
De Raad, B., & Doddema-Winsemius, M. (1999). Instincts and personality. Personality and Individual Differences, 27(2), 293–305.
Dodd, N., & Bayne, R. (2007). Internal reliability and item analysis of the Keirsey Temperament Sorter II. Journal of Psychological Type, 67(8), 71–83.
Fitzgerald, J. A., Ferres, N., Dadich, A., & Hamilton, K. (2005). The Instinctive Drives System™: A reliable and valid catalyst for improving team performance. Sydney, NSW: InCITe Research Group, College of Law and Business, University of Western Sydney.
Fitzgerald, A., Sloan, T. R., Hayes, K. J., Dadich, A. M., & Chapman, G. R. (2011). Instinctive Drives® Profiles: Exploring data, presenting results and expanding horizons. Sydney, NSW: InCITe Research Group, College of Law and Business, University of Western Sydney.
Jung, C. (1921). Psychological types. Routledge.
Kelly, K. R., & Jugovic, H. (2001). Concurrent validity of the online version of the Keirsey Temperament Sorter II. Journal of Career Assessment, 9(1), 49–59.
Marston, W. M. (1928/2013). Emotions of normal people. Vol. 158. Routledge.
Merenda, P. F., & Clarke, W. V. (1965). Self-description and personality measurement. Journal of Clinical Psychology, 21, 52–56.
Quinn, M. T., Lewis, R. J., & Fischer, K. L. (1992). A cross-correlation of the Myers-Briggs and Keirsey instruments. Journal of College Student Development, 33, 279-280.
Tucker, I. F., & Gillespie, B. V. (1993). Correlations among three measures of personality type. Perceptual and Motor Skills, 77, 650.
Waskel, S. A. (1995). Temperament types: Midlife death concerns, demographics, and intensity of crisis. The Journal of Psychology, 129, 221-233.