Introduction
The theory underlying DISC comes from William Marston’s work (Marston, 1928/2013), which proposes that individuals’ tendencies can be traced to their emotional responses to environmental stressors. The DISC assessment focuses on (a) how individuals view their environment, and (b) how individuals prefer to influence others within that environment. Along these lines, the DISC is particularly helpful in explaining why individuals react and behave in certain ways when interacting with others at work. Cloverleaf uses Cleaver Company’s version of the DISC, which is based on the original theory and assessment of DISC (Merenda & Clarke, 1965). This version entails four dimensions: Dominance (D), Influence (I), Steadiness (S), and Conscientiousness (C). To verify the validity and reliability of the DISC assessment, Cloverleaf conducted an independent analysis with its existing user base (sample size = 48,158).
Description of the DISC Assessment
Reliability Analysis
Within each of the 24 question blocks, the four items are not independent. Thus, the forced-choice question approach of the assessment does not allow for the traditional reliability analyses applied to Likert-style assessments. Nonetheless, it is possible to approximate this approach using re-coded scores. Note that this approach does not illustrate the degree to which the questions are representative of the dimensions. Instead, it allows for an investigation of individual items to evaluate whether specific items are potentially problematic.
I first created 96 variable scores that represented each of the four dimensions within each of the 24 question blocks. Within the question block, if the user rated a specific adjective that aligned with D, I, S or C as most like them, that specific dimension received a score of 2. Within the same question block, if the user rated a specific adjective aligned with D, I, S, or C as least like them, that specific dimension received a score of 0. The remaining dimensions received a score of 1. Thus, across each of the four dimensions (D, I, S, and C) there are 24 variables (e.g., D_1, D_2…D_24) with scores of 0, 1, or 2, with higher scores representing responses more representative of its dimension.
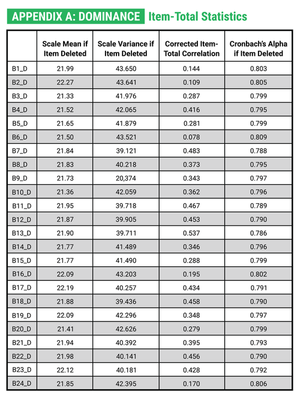
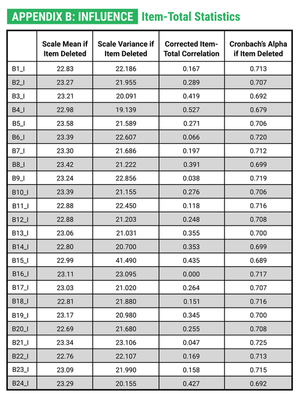
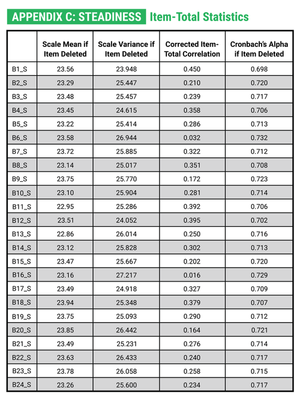
I first conducted a reliability analysis using the 24 variables for each dimension. The alpha reliabilities were .80 for Dominance, .72 for Influence, .72 for Steadiness, and .60 for Conscientiousness. I then investigated whether the alpha reliability would change when deleting any of the 24 items. For all four dimensions, there was no single item that could be deleted that would increase the alpha reliability by .1 or more (see Appendices A-D). I also evaluated the bi-variate correlation between each item and the overall dimension score (see Appendices E-H). All of the correlations were positive and statistically significant (p < .001). The average item-dimension correlation included .40 (range: .17, .60) for Dominance, .35 (range: .04, .63) for Influence, .36 (range: .10, .55) for Steadiness, and .30 (range: .09, .52) for Conscientiousness. In total, these analyses suggest that none of the variables are particularly problematic in their association with the dimension score.
Dimensionality of the DISC Assessment
The DISC is theorized as a circumplex along two continuums. The first is whether individuals view themselves as more powerful or less powerful than their environment (i.e., akin to internal versus external locus of control). The second is whether individuals view their environment as favorable or unfavorable. Dominance entails feeling more powerful than one’s environment and operating within an unfavorable environment. Influence entails feeling more powerful than one’s environment and operating within a favorable environment. Steadiness entails feeling less powerful than one’s environment and operating within a favorable environment. Conscientiousness entails feeling less powerful than one’s environment and operating within an unfavorable environment. Given this dimensionality, we would expect that each dimension is related but relatively unique.
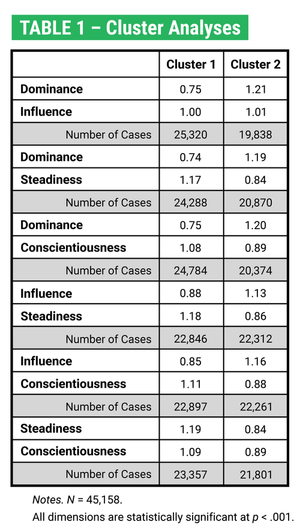
The forced-choice question approach of the assessment does not allow for the traditional factor analysis approach applied to Likert-style assessments. I, therefore, employed a cluster analysis approach to approximate the factor structure. Cluster analyses allow for an investigation of the characteristics of a specified number of profiles (i.e., clusters) within the sample data based on a specified number of dimensions (Scott & Knott, 1974). In this case, I specified two profiles based on two dimensions at a time. I did this for each possible pair (i.e., D and I, D and S, D and C, I and S, I and C, S and C). The underlying theory of DISC would suggest that the two profiles should differ such that the first profile has a higher mean score on one dimension compared to an alternative dimension, and the second profile is the inverse.
I used the mean, dimension-level score for D, I, S, and C in the cluster analyses. The findings of the cluster analyses (see Table 1) generally support a priori expectations. For example, when comparing Dominance and Influence, cluster 1 Dominance (.75) is lower than cluster 1 Influence (1.00), and cluster 2 Dominance (1.21) is higher than cluster 1 Influence (1.01). This suggests that Dominance and Influence are divergent dimensions. This expected pattern does not hold for the Steadiness and Conscientiousness comparison where the cluster scores are similar. However, each of these dimensions shows appropriate differences between the Dominance and Influence dimensions. This suggests that when users feel that they are less powerful than their environment, they might find it challenging to differentiate between their environment being favorable (Steadiness) versus unfavorable (Conscientiousness).
Test-Retest Reliability
A total of 138 users within the sample completed the DISC assessment two or more times. This allowed for investigating whether there were significant differences between the dimension scores across time. Across the 138 users, I conducted a one-sample mean difference t-test. As expected, there were no statistically significant differences for any of the four dimensions (see Table 2 below). This offers support for test-retest reliability.
Conclusion
References
Anderson, C. D., Warner, J. L., & Spencer, C. C. (1984). Inflation bias in self-assessment examinations: Implications for valid employee selection. Journal of Applied Psychology, 69(4), 574–580
Marston, W. M. (1928/2013). Emotions of normal people. Vol. 158. Routledge.
Merenda, P. F., & Clarke, W. V. (1965). Self-description and personality measurement. Journal of Clinical Psychology, 21, 52–56.
Scott, A. J., & Knott, M. (1974). A cluster analysis method for grouping means in the analysis of variance. Biometrics, 507-512.
Appendix A
Dominance – Item-Total Statistics
Appendix B
Influence – Item-Total Statistics
Appendix C
Steadiness – Item-Total Statistics
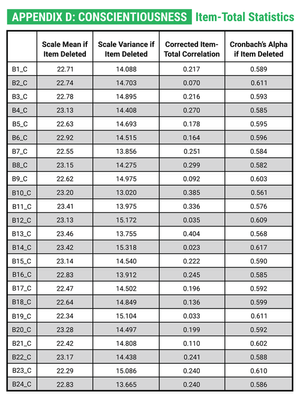
Appendix D
Conscientiousness – Item-Total Statistics
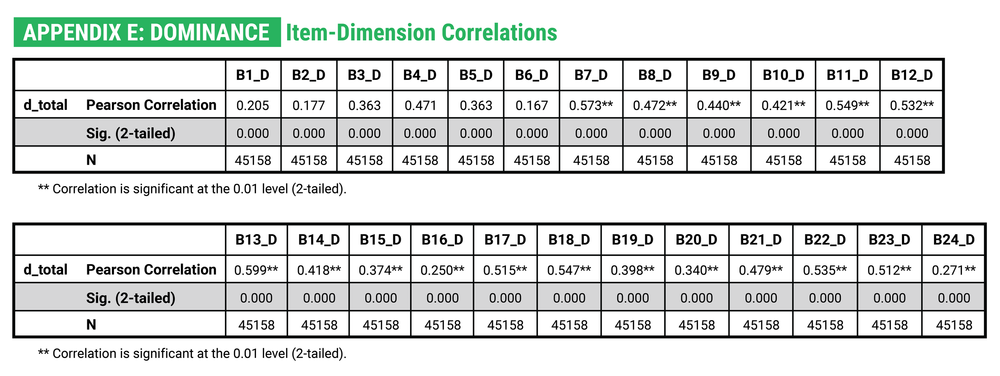
Appendix E
Dominance – Item-Dimension Correlations
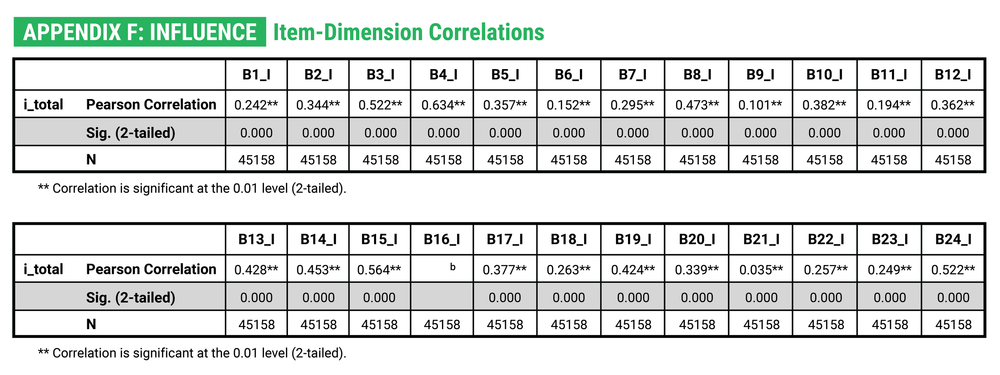
Appendix F
Influence – Item-Dimension Correlations
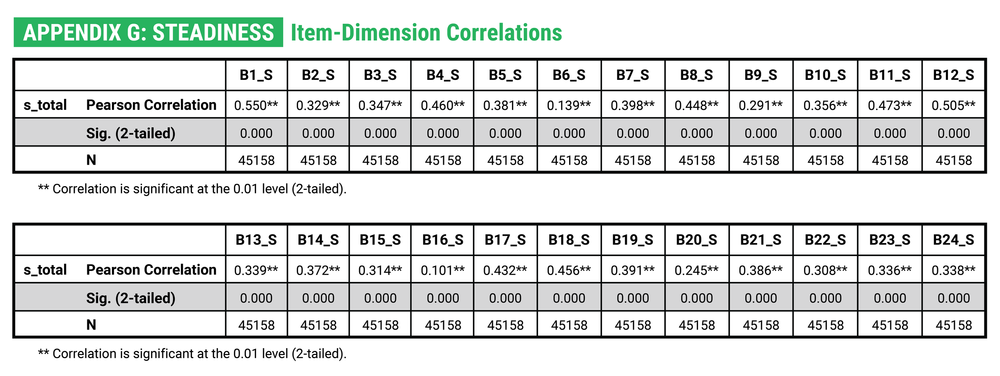
Appendix G
Influence – Item-Dimension Correlations
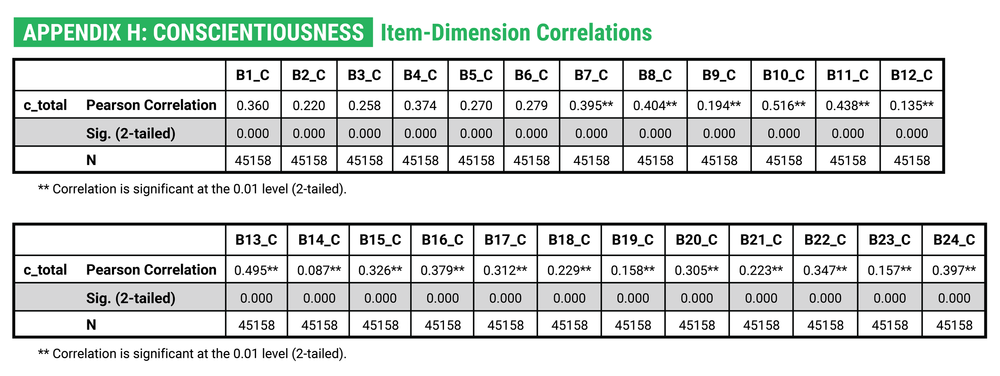
Appendix H
Conscientiousness – Item-Dimension Correlations