TL;DR:
Already know your DISC type? This guide walks through practical ways to use DISC in the workplace—improving communication, running better meetings, and aligning work styles. Use it to enhance collaboration and reduce team friction.
Already familiar with your DISC profile—but unsure how to use it day-to-day at work? You’re not alone. Many professionals understand the basics of Dominance, Influence, Steadiness, and Conscientiousness, but struggle to translate that into action with their teams.
This guide is designed for those ready to move beyond awareness and into application. You’ll learn how to:
👉 Communicate more effectively with each DISC type
👉 Run more inclusive meetings
👉 Align work and roles to team members’ behavioral strengths
Whether you’re a team leader or an individual contributor, this article will help you put DISC to work in real-world workplace scenarios.
What Are the Benefits of Applying DISC at Work?
Incorporating DISC into the workplace can improve communication, giving and receiving feedback, and conflict resolution to enhance team performance. Managers can create a more cohesive and effective team by understanding each person’s motivational tendencies, communication styles, and cognitive diversity.
✅ Understanding Motivational Tendencies
One of the primary benefits of using DISC in the workplace is its ability to provide information about the motivational tendencies of individuals. For example, individuals with high Steadiness scores may value cooperation and sincerity, while those with higher Dominance scores may prioritize pushing towards goals and outcomes. Understanding these tendencies can help managers better motivate and engage members of the team.
✅ Enhancing Communication
DISC scores can also provide insights into effectively communicating with others. For instance, a team with a disproportionate number of high Dominance scores may create an environment where those with higher Steadiness or Compliance scores do not feel comfortable contributing ideas. Managers can create a more inclusive and productive environment by understanding different communication styles.
✅ Depersonalizing Conflict
DISC can also help depersonalize conflict by providing a common communication language for a team. For example, using a team dashboard to display aggregate DISC results can help team members better understand each other’s conflict management styles and triggers. This can lead to developing a “conflict contract” that establishes group norms for dealing with conflict and helps generate team buy-in.
✅ Capitalizing on Cognitive Diversity
Studies have shown that teams with higher cognitive diversity produce better outcomes. DISC can help teams understand their level of cognitive diversity and how to harness it to improve outcomes. Using the team DISC wheel, managers can see where the team lacks certain styles or where a member may play a critical role in achieving team goals.
✅ Defining the Right Roles
DISC can help managers better understand how team members fit into their roles. Managers can create a more productive and engaged team using DISC to match individuals with roles that align with their behavioral patterns. Assigning tasks that conflict with their natural style may lead to burnout or turnover.
🧠 Related Resource: Talent Development In The Age of AI
Want to scale coaching and personality insights across your organization—without burning out your HR team?
👇 Get the Playbook: A practical guide to developing human skills at scale using automation and behavioral science.

Talent Development In The Age Of AI Playbook
Get a practical guide to scale human skill development across your org, without the usual friction.
Dominance (D): How to Lead and Motivate D Types
Dominance: Balancing Drive with Team Dynamics
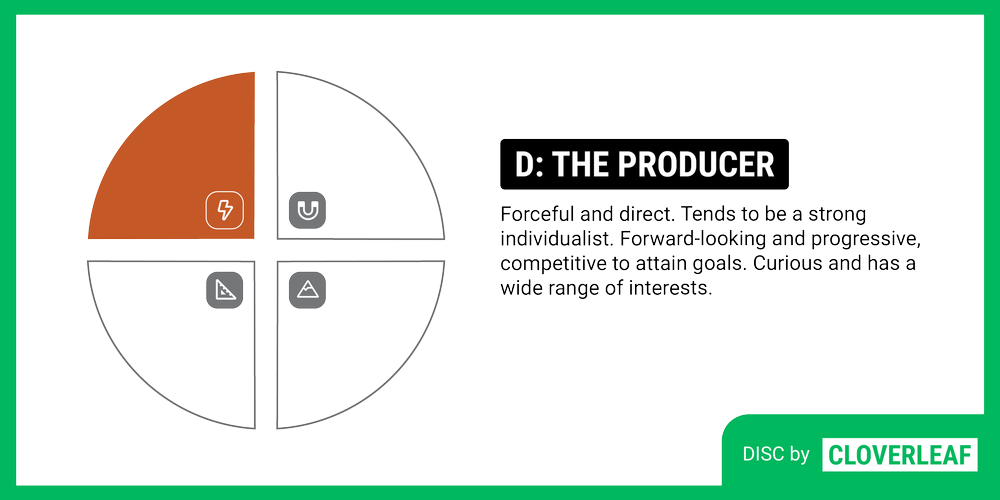
The D in DISC stands for Dominance, which characterizes driven, goal-oriented, and assertive individuals. They are natural leaders who seek control and authority, viewing them as positive qualities. However, in their quest for success, D types may prioritize tasks and outcomes over the well-being and contributions of their co-workers.
High-D individuals must balance their drive for achievement with understanding how their actions affect their team dynamics. Overly focusing on tasks can dismiss the importance of building relationships and collaborating. This can ultimately hinder team success and create a hostile work environment.
Leaders with high-D traits can motivate their team towards a shared goal while creating a culture of openness, respect, and trust. By balancing their dominant nature with empathy and consideration for others, they can harness their strengths to achieve success for the team.
Influence (I): How to Collaborate With High-I Teammates
Influence: Harnessing Energy for Collaborative Success
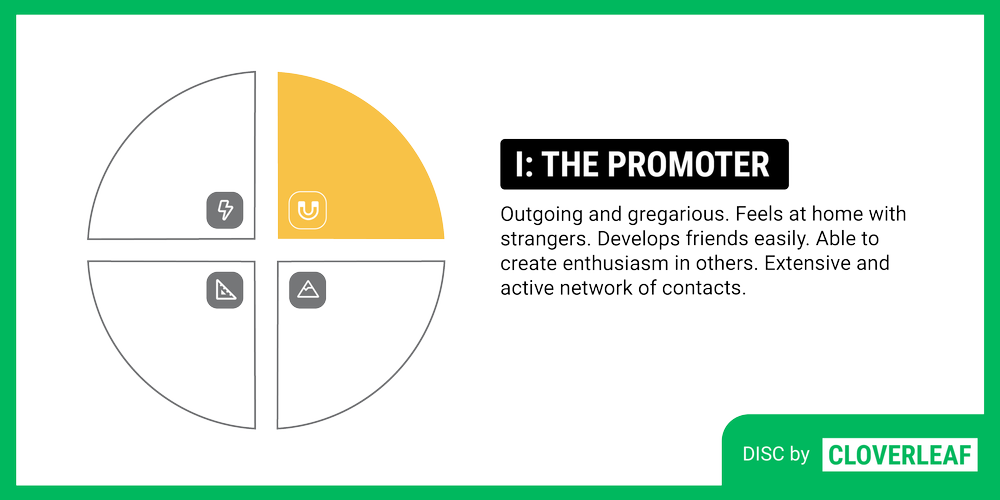
“I” stands for Influence in the DISC model, representing individuals prioritizing social interaction and relationship-building. I types are energized by being around people and are drawn to change, seeing it as a positive force that can bring about new opportunities. They excel at connecting with others, using their charisma and personal skills to generate enthusiasm and excitement.
One potential downside of the I style is that their enthusiasm and love of variety can sometimes lead to impulsiveness and distractibility. They may lose sight of the end goal or become disorganized in pursuing new experiences. As a result, it can be helpful for Is to work with someone who can provide structure and help keep them focused on the task at hand.
Influencing types bring a valuable perspective to teams, and their ability to build relationships and generate excitement can help keep teams motivated and engaged. By understanding their strengths and potential pitfalls, Is can use their skills to benefit their team and the organization.
Steadiness (S): Creating Harmony With High-S Employees
Steadiness: Fostering Team Harmony and Collaboration
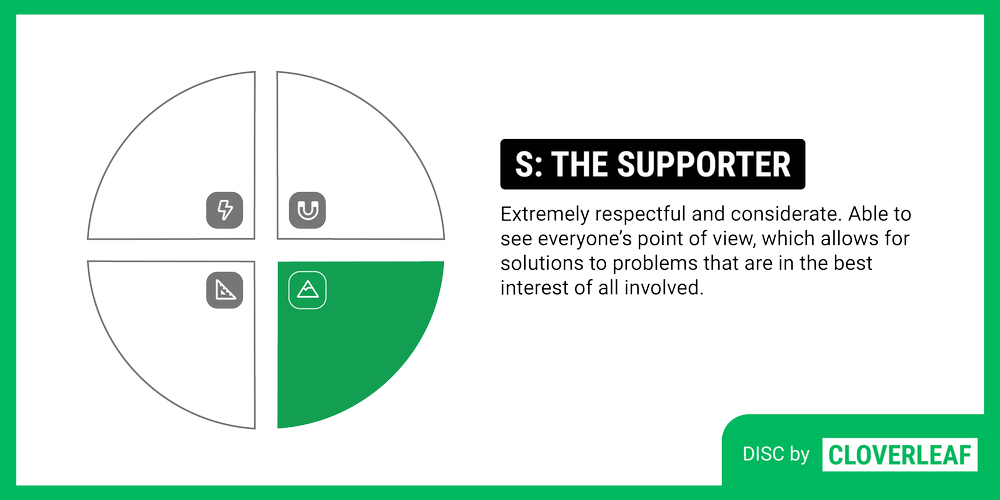
These individuals are team players who prioritize a harmonious and inclusive team culture. They value stability and seek to create that for their team.
Others often consider them to be great listeners and have supportive teammates. They don’t like change or conflict and rarely initiate it, even if it costs them. It’s also essential to include them in any team decisions, give them ample notice if any changes need to be made, and seek their opinions.
S-Types like to ensure everyone is heard and foster a strong sense of connection among teammates. By understanding and leveraging the strengths of the S style, you can create a positive and supportive team environment.
Conscientiousness (C): Supporting High-C Work Styles
Conscientiousness: Leveraging Attention to Detail for Team Success
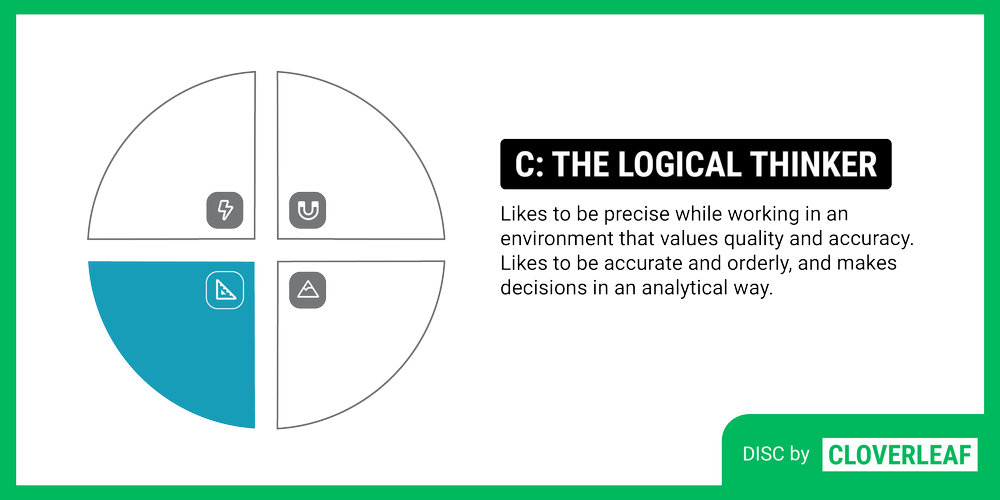
The letter C represents traits that value a high focus on details and a desire for excellence. Individuals with this personality type are motivated to deliver quality work and are experts in their area of work. They hold themselves and their team to high standards and seek feedback to ensure their work meets expectations.
While conscientious individuals bring value to a team, they can find it stressful when faced with last-minute changes or rushed schedules. It’s important to give them adequate notice and allow them to work independently. They appreciate regular feedback but must be presented with kindness, as they can be sensitive to criticism.
These individuals thrive when given tasks that require attention to detail and expertise. They don’t need much collaboration or social interaction and may prefer to work from a private office or home. You can maximize their contribution to the team’s success by recognizing and leveraging their strengths.
How To Apply DISC With Your Team
The DISC circle illustrates how individuals with different personality types respond to change differently.
How DISC Styles Respond to Change at Work
The top of the circle represents the Ds and Is, who are drawn to change and view it as a positive force that can help them achieve their goals. In contrast, the Ss and Cs at the bottom of the circle are change-averse and can perceive change as an opposing force that may impede their effectiveness. They fear that chaos may arise in the team due to change.
Which DISC Types Are People-Oriented vs. Task-Oriented?
The DISC model further categorizes individuals into two groups based on their preference for people or task-oriented work. Those on the I and S side are drawn to people, collaboration, and service, and those on the D and C sides are attracted to tasks, execution, and accomplishment.
Effective Communication Strategies For Each DISC Type
The way people communicate also varies based on their place in the circle. Ds prioritize clarity over diplomacy and may come across as blunt, while Is focus on building relationships and connection.
Ss prioritize harmony and use soft-spoken, affirming communication, making direct communication difficult. Cs prioritize clear communication based on data and have a black-and-white approach to good and bad.
It’s helpful to slow down and use a measured approach when speaking to Ss and Cs, especially when giving feedback or asking for information. Providing notice and time to synthesize information is crucial for Ss and Cs.
Providing advanced notice about impending changes or project deadlines can help gain buy-in from Cs and Ss. Communicating how changes will benefit the organization or team can help achieve their support.
D and I personality types respond well to direct, confident, and energetic communication. They appreciate clear goals, objectives, and deadlines. When communicating with a D, it’s essential to be clear and concise, avoiding too much detail or ambiguity.
When communicating with an I, it’s important to be enthusiastic and engaging, using stories and anecdotes to keep their attention. They appreciate a more conversational tone and love to be recognized for their contributions.
D and I personality types appreciate a sense of urgency and enthusiasm in communication, and giving them space to express their ideas and opinions is important. They also respond well to visual aids and are more likely to be motivated by positive feedback and recognition than criticism.
How to Use DISC During Team Meetings
During meetings, it’s important to be aware of communication patterns that can reveal someone’s DISC style. The Ds and Is tend to speak up first and express their opinions, while the Ss and Cs may reserve their comments. To ensure all members contribute, set aside time for Ss and Cs to provide feedback and opinions. For example, dedicating the last 15 minutes of the meeting can be effective. Creating a cadence for participation can also encourage involvement.
When Ds and Is lead meetings, ensuring everyone’s voice is heard is essential. They may assume that others will speak up if they have an idea, but encouraging participation is important. Awareness of each DISC type can help create routines that allow for informed decisions and ensure everyone’s voice is heard.
How Does The DISC Assessment Differ From Other Assessments?
The DISC assessment is unique in that it provides a simple, accessible way to understand and categorize behavioral tendencies, which can improve communication, teamwork, and leadership in various contexts. Other assessments may focus on different aspects of an individual’s personality or behavior, such as emotional intelligence, cognitive abilities, values, and motivating factors.
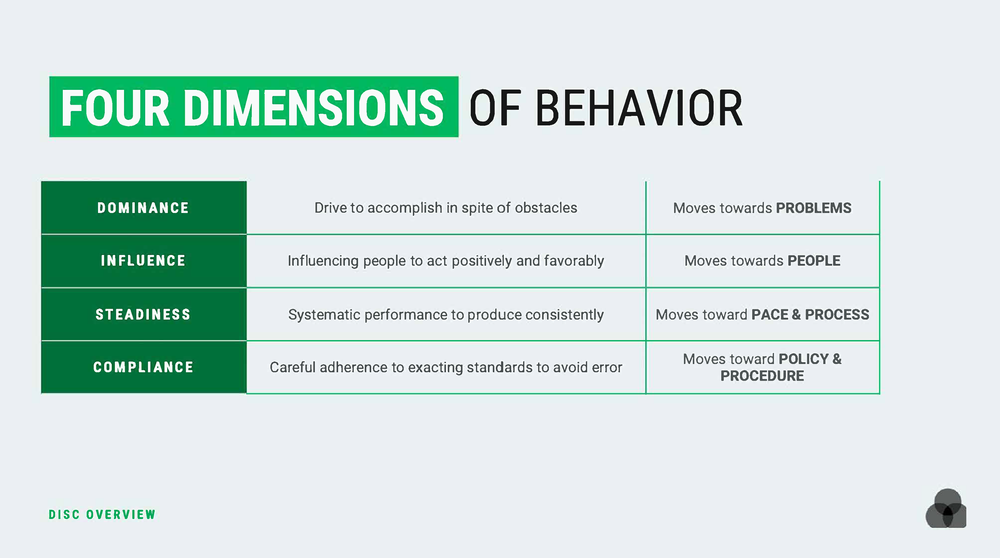
The DISC profile differs from other assessments in focusing specifically on an individual’s response to favorable and unfavorable situations. It measures their tendency toward four behavioral traits: dominance, influence, steadiness, and compliance. DISC provides insight into individual interactions and responses to stress and conflict.
How Cloverleaf Helps You Apply DISC Insights in Real Work Scenarios
DISC profiles aren’t always one-dimensional. Cloverleaf’s assessment and team dashboard reveal the complex interplay between behavioral styles—surfacing combinations and tensions that other tools often overlook.
Cloverleaf’s DISC assessment can reveal conflicting values that individuals may possess. For instance, individuals with a strong I and C may experience conflicting values because they enjoy a fast-paced environment with people and frequent changes from the I. Still, from the C, they also desire consistency.
Some characteristics may present less in individuals because they are self-regulating, which is a superpower. Balancing opposing values is a unique strength, as it allows one to see both sides of an issue.
Those with strengths in opposing quadrants, like IC and DS, have complementary strengths that can benefit a team without a partner or collaborator. This ability to see both sides of the picture can drive external collaboration and build consensus while maintaining attention to detail and striving for excellence.
In contrast, a traditional influence strength may become exhausted with detailed work. Still, someone with a balanced profile can have the energy to dig into the data and make new discoveries.
The rare combination of a high S and D result is present in only 2% of Cloverleaf users. These individuals possess a strong pioneering driver while valuing connection and being highly supportive of their team. They love change, power, and authority but also desire stability and harmony with others.
While some people with this combination may focus their drive inward rather than solely on achieving goals, it’s important to note that there is still a strong desire to move forward.
Key Takeaways: Applying DISC for Better Teamwork
Each quadrant in the DISC profile is driven by particular questions that they find most important.
-
Ds are goal-oriented and prioritize understanding where they’re going and how to get there.
-
Influencers prioritize collaboration, resourcefulness, and the enjoyment of the task.
-
Steadiness drivers want to know how they will execute a task and how it will impact the team’s well-being.
-
Conscientious individuals want to understand the task, including its standards, expectations, and boundaries (such as time, resources, and commitments).
By using DISC in the workplace, you can tailor your communication and approach to meet their unique needs and preferences.
Understanding DISC results and the communication styles of each quadrant can significantly improve your team’s dynamics and productivity. By knowing the questions that each quadrant is interested in, you can communicate more effectively, meet everyone’s needs, and gain their buy-in faster.
Put DISC Into Action With Your Team
You already know your DISC profile—now it’s time to use it to elevate how your team works together.
Cloverleaf helps you apply DISC daily with personalized coaching insights, communication prompts, and team dashboards that reveal how every individual contributes to the whole.
✅ Already know your type?
✅ Want to better collaborate with others?
👉 Explore DISC-Powered Coaching With Cloverleaf
FAQs About Using DISC at Work
Q: How do I use DISC in the workplace if I already know my type?
A: Start by understanding how your style interacts with others on your team. Use DISC to guide conversations, delegate work, and reduce conflict.
Q: What’s the best way to use DISC in team meetings?
A: Set structured time for all styles to contribute. Ds and Is speak up fast—Ss and Cs often need space or prompts.
Q: Can DISC help managers give better feedback?
A: Yes. Tailor your delivery—Ds want directness, Cs want clarity, Is want encouragement, and Ss want support.
A chronotype quiz helps you understand the biological clock that controls your body’s rhythms. Your Chronotype may be why you feel grumpy in the morning or at your best at 5 am. It may be why you feel exhausted in the evening or focused by 8 pm. This genetic, biological clock affects more than your sleep pattern. It affects when your optimal times to work, perform, eat, plan, exercise, and more.
Are you a Starter, Pacer, or Anchor? Take this quiz to find out. Discover your Chronotype today by taking the Energy Rhythm Assessment.
What Does Chronotype Mean?
Unlike a standard clock, not every person’s biological clock keeps the same time or pace. Of course, there’s a reason why people say they’re not a ‘morning person.’
Some individuals are more productive in the morning than others, while some function better in the evening. Everyone has an individual sleep schedule that affects their day-to-day performance.
Your body is programmed to wake, sleep, and function much better at certain times of the day than others. People fall into different ‘Chronotypes’ based on general awake and sleep preferences or needs. Your Chronotype reveals what rhythms are optimal for you to work positively with your body, not against it.
A chronotype quiz can help you understand your biological programming better and discover which Chronotype you relate to the most.
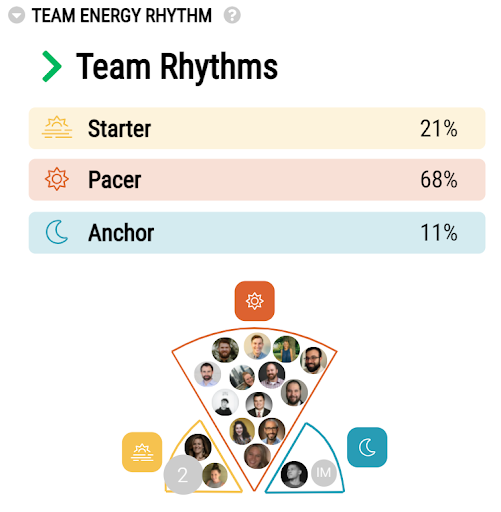
What Are The Three Chronotypes?
There are three primary Chronotypes – Starter, Pacer, and Anchor. These Chronotypes correspond with your unique biological clock.
In the workplace, Chronotype matters because it affects the times of day an individual will feel most alert, focus on tasks the best, and what jobs they do best during certain times of the day.
Having varied chronotypes on a team can benefit the team’s productivity and creativity if every team member knows their differences. Teams can get knowledge of their differences, use it to their advantage, and understand how they will feel through healthy collaboration.
The Cloverleaf Chronotype quiz can reveal a lot about a person concerning their energy patterns over a typical 9-5 workday, what tasks are most manageable for them to excel at during specific times of the day, and what their team’s flow may look like daily.
Using the Cloverleaf Chronotype Quiz, you can discover your Chronotype in just 90 seconds. The quiz includes questions to better understand your biological programming to reveal your Chronotype.
Cloverleaf’s Energy Rhythm Assessment draws from research about circadian rhythm and circadian typology. Circadian rhythm refers to the internal processes which regulate the sleep/wake cycle and affect people’s biological and psychological functioning in everyday life, health, and disease (Adan et al., 2012).
Your chronotype is one of three types:
- Morning type (the Starter)
- Midday type (the Pacer)
- Evening type (the Anchor)
The Starter Chronotype is about 15-25 percent of the population.
Starters are morning-type people. The Starter is an individual who enjoys an early sleep schedule and early wake time. Their peak happens in the early morning, and they experience their trough in the middle of the afternoon. This is around 12-1 pm time (lunch hours). Their recovery tends to occur in the late afternoon to early evening, around the end of their 9-5 workday.
The Pacer Chronotype is about 50 percent of the population.
Pacers are most productive during mid-morning. Pacers have a similar energy rhythm to Starters, but their peak happens in the mid-morning portion of the day. Pacers get up early and have their trough mid-afternoon, with a recovery period from late afternoon to early evening towards the end of their 9-5 workday.
The Anchor Chronotype is about 15-25 percent of the population.
Anchors are commonly known as the ‘Night Owl.’ The Anchor will often sleep in and be ready to sleep late in the evening. Their energy rhythm is similar to those that are considered Starters. Anchors experience their peak in the late afternoon to early evening at the end of a typical 9-5 day.
Anchors may have more variability during their trough than Starters or Pacers, but that trough may also be longer. Their trough happens early to mid-afternoon, with a recovery period in the morning (beginning of a typical 9-5 workday). The Anchor will often go to bed late into the night.
Pacers are the most common type among adults. And it’s important to remember that all Starters, Pacers, and Anchors experience a peak, trough, and recovery period in their day.
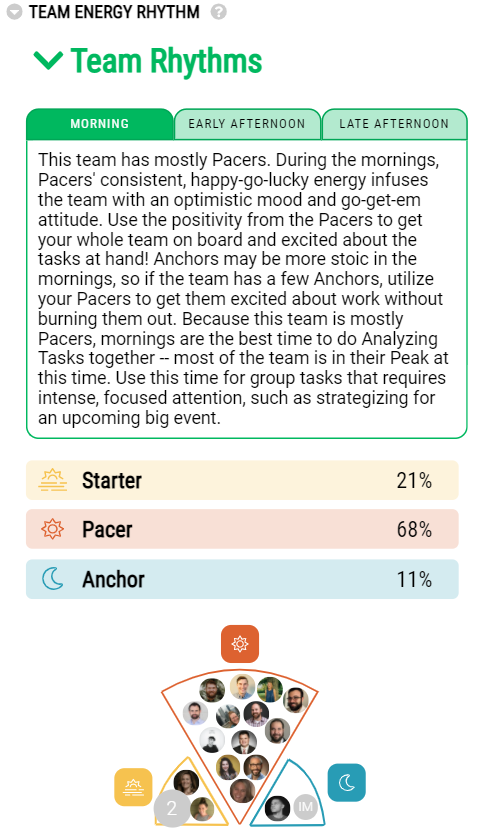
Understanding Your Chronotype Quiz Results
Knowing your Energy Rhythm can help you determine the amount of sleep and energy you need to excel. Learning more about your team member’s assessment results can help improve collaborative efforts.
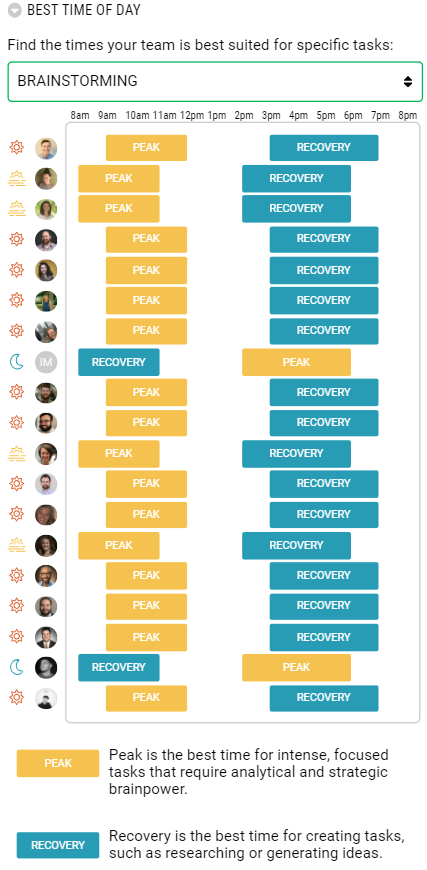
Peak time is best for analyzing tasks, requiring lots of analytical and strategic brainpower.
A Trough is best for maintenance tasks – those low-brainpower, straightforward tasks like adding to your calendar or answering emails.
Recovery is best for Creating Tasks.
People experience a rise in energy, mood, and vigilance during their peak. People typically experience a dip in energy, mood, sleep performance, and care during their trough. During recovery, energy and mood take a sharp rise. The peak, trough, and recovery periods occur at different times for people, depending on their Chronotype.
Discover your Chronotype today with Cloverleaf. Take the Chronotype quiz to find out which Chronotype you are to start maximizing your effort and better utilizing your energy.
HUMAN SKILL PROGRAMS ARE HITTING LIMITATIONS...
5 THINGS THIS FREE RESOURCE WILL TEACH YOU
- Close the widening gap between learning and on-the-job application
- Overcome the tension of pausing productivity for development opportunities
- Integrate learning so it is actually in the flow of work
- The evolution of human skill development
- What Automated Coaching™ is and how it works.
Introduction
The 16 Types assessment is based on Carl Jung’s Theory of Psychological Types (Jung, 1921), which proposes that there are four primary dimensions among which we can evaluate personality traits. The benefit of the 16 Types assessment is that it broadly covers the most prominent personality traits. This is particularly helpful because personality traits are relatively consistent across time and situation, and can be reliably be connected to observable workplace behaviors.
Cloverleaf uses the Keirsey Temperament Sorter® II (KTS) (Keirsey, 1998), which is based on self-reporting of observable behaviors. Across several studies, external researchers (i.e., unaffiliated with the assessment entity) illustrate construct validity and reliability for the assessment (e.g., Abramson, 2010; Dodd & Bayne, 2007; Kelly & Jugovic, 2001; Quinn et al., 1992; Tucker & Gillespie, 1993; Waskel, 1995). What follows is a construct validity evaluation using Cloverleaf’s 16 Types participants.
The four dimensions of the 16 Types assessment include energy, perception, judgment, and orientation. Each dimension operates along a theoretical continuum with two polar anchors. The energy dimension addresses the degree to which sensory perception is draining (introverted) or energizing (extroverted). The perception dimension addresses the degree to which we process information using micro-level facts and details (sensor) or macro-level abstraction and patterns (intuition). The judgment dimension addresses the degree we place importance on logic-based information (thinker) or values-based information (feeler). The orientation dimension addresses the extent to which we prefer to have a fluid and adaptable approach (perceiver) or an orderly and controlled approach (judger) to our lives.
Respondents are given a series of 70 questions. Each question is specific to one of the four dimensions. For each question, the respondent is asked to select one of two responses. The two response options are representative of each anchor (e.g., introversion versus extroversion, sensor versus intuit, feeler versus thinker, and perceiver versus judger).
The energy dimension has a total of 10 questions, and the remaining three dimensions each have a total of 20 questions. The percentage of the responses representing one anchor or the other dictates their final score for each dimension. The user is then given their type (e.g., INTJ) based upon which of the anchors for each of the four dimensions had the highest percentage.
Sample and Methodology
The sample consisted of 176,424 participants that completed the 16 Types assessment using the Cloverleaf platform. To illustrate construct validity, I employed several techniques. First, I assessed inter-item reliability for each of the four dimensions. Second, I assessed the overall factor structure by conducting confirmatory factor analyses. Third, I assessed convergent and divergent validity by evaluating correlations among related assessment dimensions. Fourth, I assessed test-retest reliability among a subset of users that have taken the assessment multiple times.
Reliability Analyses
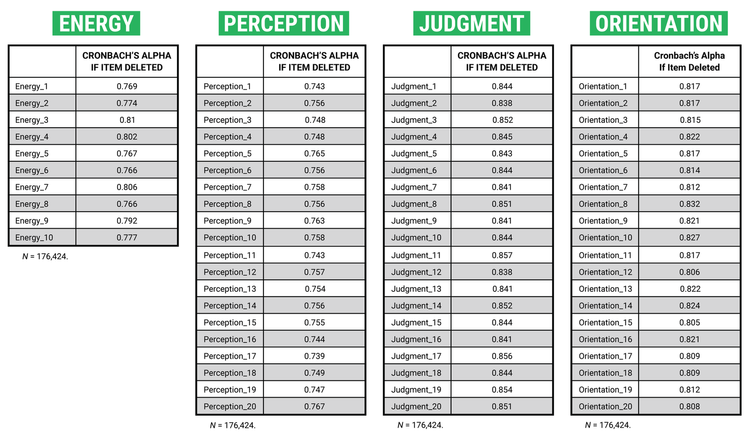
I conducted reliability analyses to evaluate the degree to which the items within the assessment were reliably evaluating the dimensions of interest. Each question offers two options. The first is representative of one endpoint of the continuum (e.g., introverted) and the second is representative of the other endpoint of the continuum (e.g., extroverted). The selections were coded such that the first option was -1 (i.e., introverted, sensor, feeler, and perceiver) and the second option was +1 (extroverted, intuition, thinker, and judger). The 10-item energy dimension (α = .80), the 20-item perception dimension (α = .76), the 20-item judgment dimension (α = .85), and the 20-item orientation dimension (α = .82), all had Cronbach alpha reliabilities above the traditional .70 threshold. Further, the findings illustrated that removal of any one item would not substantially enhance the overall reliability (see Table 1).
Table 1. Reliability Analysis
Factor Analyses
We conducted factor analyses to assess the overall dimensionality of the assessment (see Table 2). Specifically, to investigate whether there is empirical support for the four theoretically derived dimensions, I conducted a forced, four-factor analysis with varimax rotation. Overall, the factor loadings aligned well with the theoretical factor structure.
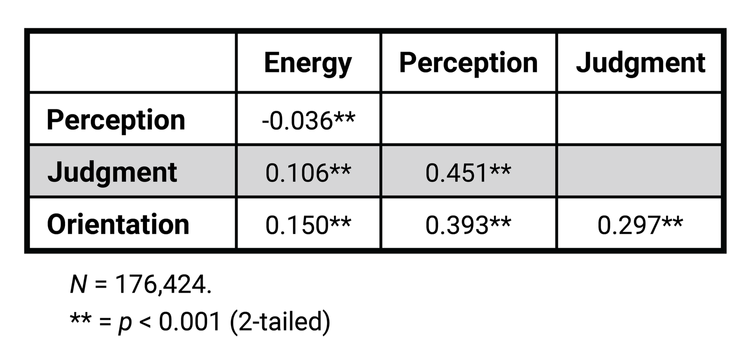
Within the energy dimension, there were no significant cross-loadings. Within the perception dimension, there were four items with cross-loadings on the judgment dimension (i.e., items 10, 12, 13, and 20). Within the judgment dimension, there was one item with a cross-loading on the perception dimension (i.e., item 17). Within the orientation dimension, there were two cross-loading items, one for the perception dimension (i.e., item 13) and one for the judgment dimension (i.e., item 10). In each case, the cross-loadings were relatively minor. Further, in each case, the cross-loadings align with the expected relationships among dimensions. Specifically, correlational analyses illustrate that the perception and judgment dimensions (r = .45, p < .01), the perception and orientation dimensions (r = .39, p < .01), and the judgment and orientation dimensions (r = .30, p < .01), have low to moderate positive associations (see Table 3).
Table 2. Factor Analysis
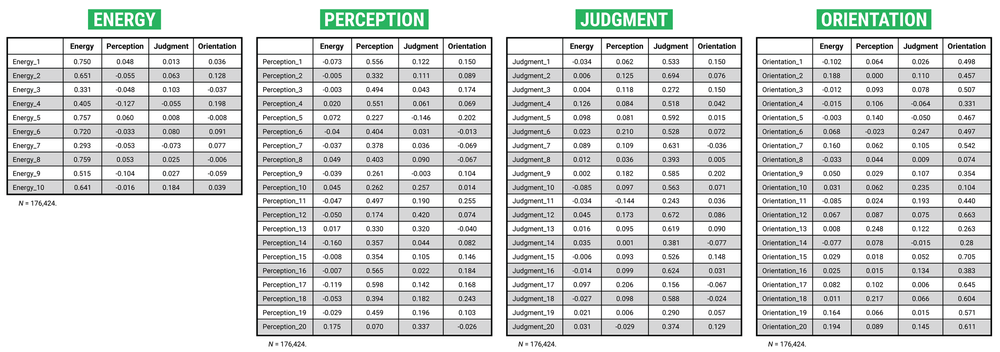
Table 3. Bi-Variate Correlations
Convergent and Divergent Validity
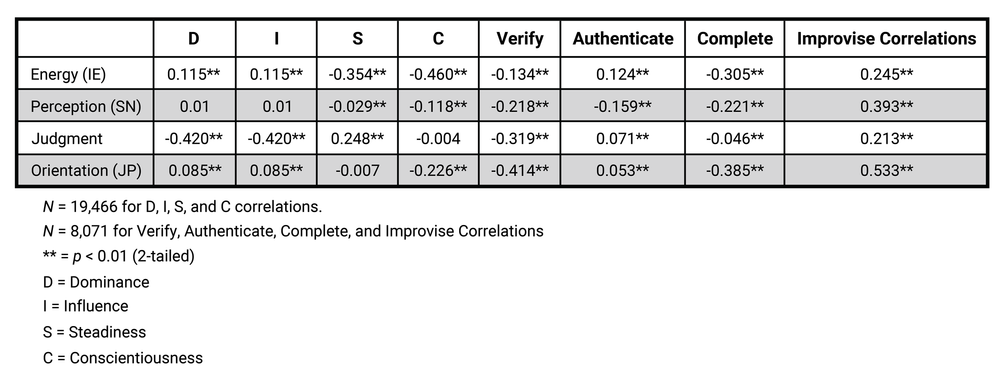
Of the 176,424 participants that completed the 16 Types assessment, 19,466 have completed the DISC personality assessment (Marston, 1928/2013; Merenda & Clarke, 1965), and 8,071 have completed the Instinctive Drive assessment (De Raad & Doddema-Winsemius, 1999; Fitzgerald et al., 2006; Fitzgerald et al., 2011) within the Cloverleaf platform. We conducted correlation analyses within these sub-groups to instigate convergent and divergent validity.
The DISC assesses traits, but with a focus on the approach and outlook one is likely to have when interacting with others. Individuals higher in dominance (D) tend to be confident, blunt, demanding, and task-focused. Individuals higher in influence (I) tend to be enthusiastic, persuasive, optimistic, and relationship-focused. Individuals higher in steadiness (S) tend to be calm, deliberate, loyal, and dependable. Individuals higher in conscientiousness (C) tend to be independent, competent, and detail-focused.
The Instinctive Drives assessment evaluates individuals’ innate behavioral tendencies. Instincts are similar to traits in that they dictate specific sets of behaviors. However, instincts also address why such behaviors are preferred (i.e., what drives the behavior). The assessment determines whether respondents prefer to “use” or “avoid” four instinctive drives: verify, authenticate, complete, and improvise. Individuals that use verify need clarity and are driven to “get it right.” Individuals that use authenticate need open and direct communication and are driven to see tangible results. Individuals that use complete need time to focus and are driven to make progress. Individuals that use improvise need to create and interact with others and are driven to make things possible.
Extroverts are more socially driven than their introverted counterparts. As expected, the findings illustrate that extroversion (higher on energy dimension) was strongly associated with influence (r = .647, p < .01), authenticate (r = .124, p < .01), and improvise (r = .245, p < .01), all of which involve more communicative and relational tendencies. Alternatively, introverts prefer deep-thinking activities that can be done in solitude. Along those lines, introversion (lower on energy dimension) was associated with steadiness (r = -.354, p < .01), conscientiousness (r = -.460, p < .01), verify (r = -.134, p < .01), and complete (r = -.460, p < .01), all of which entail task-focused tendencies.
Intuits notice patterns, focus on the big picture, and are forward-looking. As expected, I found that intuition (higher on perception dimension) was associated with improvise (r = -.393, p < .01), which also entails seeing and pursuing opportunities. Alternatively, sensors focus on facts and details. Along those lines, we found that sensor (lower on perception) was associated with conscientiousness (r = -.118, p < .01), verify (r = -.218, p < .01), authenticate (r = -.159, p < .01), and complete (r = -.221, p < .01), all of which entail the same focus on finding and applying evidence to decision-making.
Feelers tend to be warm and compassionate. The findings support this direction, illustrating that feeler (higher on judgement) is associated with influence (r = .271, p < .01) and steadiness (r = .248 p < .01), which entail being interested in and kind towards others. Alternatively, thinkers tend to focus on logic and seeking the truth. The findings support this direction, illustrating that thinker (lower on judgment) is associated with verify (r = -.319, p < .01), which is also about seeking out the truth through facts. This need for truth and logic can also come across as lacking compassion or empathy, which aligns with findings illustrating that thinking is associated with dominance (r = -.420, p < .01), which can come across as being blunt.
Perceivers like to keep things open-ended. The findings support this direction, illustrating that perceiver (higher on orientation) is positively associated with influence (r = .159, p < .01) and improvise (r = .533, p < .01), which both entail a capacity to be more adaptable. Alternatively, judgers like order and process. Along those lines, the findings illustrate that judger (lower on orientation) is associated with conscientiousness (r = -.226, p < .01), verify (r = -.414, p < .01), and complete (r = .385, p < .01), all of which entail being steadfast in keeping things organized and under control.
Table 4. Bi-Variate Correlations with Related Constructs
Test-Retest Reliability
To evaluate test-retest reliability I selected a random sub-set (N = 224) of participants that completed the 16 Types assessment twice. We conducted a mean difference test to evaluate whether each of the four dimensions had a significant change when comparing the first and second assessment scores. The mean difference for energy (mean difference = .028, p = .589), perception (mean difference = -.060, p = .110), judgment (mean difference = .000, p = .992), and orientation (mean difference = -.027, p = .491), were not statistically significant, offering evidence of test-retest reliability.
References
Keirsey, D. (1998). Please understand me II: Temperament, character, intelligence. Prometheus Nemesis Book Company.
Abramson, N. R. (2010). Internal reliability of the Keirsey Temperament Sorter® II: Cross-national application to American, Canadian, and Korean samples. Journal of Psychological Type, 70(2), 19–30.
De Raad, B., & Doddema-Winsemius, M. (1999). Instincts and personality. Personality and Individual Differences, 27(2), 293–305.
Dodd, N., & Bayne, R. (2007). Internal reliability and item analysis of the Keirsey Temperament Sorter II. Journal of Psychological Type, 67(8), 71–83.
Fitzgerald, J. A., Ferres, N., Dadich, A., & Hamilton, K. (2005). The Instinctive Drives System™: A reliable and valid catalyst for improving team performance. Sydney, NSW: InCITe Research Group, College of Law and Business, University of Western Sydney.
Fitzgerald, A., Sloan, T. R., Hayes, K. J., Dadich, A. M., & Chapman, G. R. (2011). Instinctive Drives® Profiles: Exploring data, presenting results and expanding horizons. Sydney, NSW: InCITe Research Group, College of Law and Business, University of Western Sydney.
Jung, C. (1921). Psychological types. Routledge.
Kelly, K. R., & Jugovic, H. (2001). Concurrent validity of the online version of the Keirsey Temperament Sorter II. Journal of Career Assessment, 9(1), 49–59.
Marston, W. M. (1928/2013). Emotions of normal people. Vol. 158. Routledge.
Merenda, P. F., & Clarke, W. V. (1965). Self-description and personality measurement. Journal of Clinical Psychology, 21, 52–56.
Quinn, M. T., Lewis, R. J., & Fischer, K. L. (1992). A cross-correlation of the Myers-Briggs and Keirsey instruments. Journal of College Student Development, 33, 279-280.
Tucker, I. F., & Gillespie, B. V. (1993). Correlations among three measures of personality type. Perceptual and Motor Skills, 77, 650.
Waskel, S. A. (1995). Temperament types: Midlife death concerns, demographics, and intensity of crisis. The Journal of Psychology, 129, 221-233.

Introduction
The theory underlying DISC comes from William Marston’s work (Marston, 1928/2013), which proposes that individuals’ tendencies can be traced to their emotional responses to environmental stressors. The DISC assessment focuses on (a) how individuals view their environment, and (b) how individuals prefer to influence others within that environment. Along these lines, the DISC is particularly helpful in explaining why individuals react and behave in certain ways when interacting with others at work. Cloverleaf uses Cleaver Company’s version of the DISC, which is based on the original theory and assessment of DISC (Merenda & Clarke, 1965). This version entails four dimensions: Dominance (D), Influence (I), Steadiness (S), and Conscientiousness (C). To verify the validity and reliability of the DISC assessment, Cloverleaf conducted an independent analysis with its existing user base (sample size = 48,158).
Description of the DISC Assessment
The DISC assessment offers 24 questions (also called a question block), each with four adjectives (or phrases). For each of the 24 questions, users must select which of the four adjectives is most like them and which of the four adjectives is least like them. Example adjectives include “persuasive,” “even-tempered,” “self-reliant,” and “generous.” Each of the adjectives within each question block either: (a) contributes to the D, I, S, or C score; (b) detracts from the D, I, S, or C score; or (c) neither contributes nor detracts from the D, I, S, or C score. Scores for D, I, S, and C are generated based on Cleaver Company’s proprietary algorithm. The range of scores for each dimension is between 0 and 100.
Reliability Analysis
Within each of the 24 question blocks, the four items are not independent. Thus, the forced-choice question approach of the assessment does not allow for the traditional reliability analyses applied to Likert-style assessments. Nonetheless, it is possible to approximate this approach using re-coded scores. Note that this approach does not illustrate the degree to which the questions are representative of the dimensions. Instead, it allows for an investigation of individual items to evaluate whether specific items are potentially problematic.
I first created 96 variable scores that represented each of the four dimensions within each of the 24 question blocks. Within the question block, if the user rated a specific adjective that aligned with D, I, S or C as most like them, that specific dimension received a score of 2. Within the same question block, if the user rated a specific adjective aligned with D, I, S, or C as least like them, that specific dimension received a score of 0. The remaining dimensions received a score of 1. Thus, across each of the four dimensions (D, I, S, and C) there are 24 variables (e.g., D_1, D_2…D_24) with scores of 0, 1, or 2, with higher scores representing responses more representative of its dimension.
I first conducted a reliability analysis using the 24 variables for each dimension. The alpha reliabilities were .80 for Dominance, .72 for Influence, .72 for Steadiness, and .60 for Conscientiousness. I then investigated whether the alpha reliability would change when deleting any of the 24 items. For all four dimensions, there was no single item that could be deleted that would increase the alpha reliability by .1 or more (see Appendices A-D). I also evaluated the bi-variate correlation between each item and the overall dimension score (see Appendices E-H). All of the correlations were positive and statistically significant (p < .001). The average item-dimension correlation included .40 (range: .17, .60) for Dominance, .35 (range: .04, .63) for Influence, .36 (range: .10, .55) for Steadiness, and .30 (range: .09, .52) for Conscientiousness. In total, these analyses suggest that none of the variables are particularly problematic in their association with the dimension score.
Dimensionality of the DISC Assessment
The DISC is theorized as a circumplex along two continuums. The first is whether individuals view themselves as more powerful or less powerful than their environment (i.e., akin to internal versus external locus of control). The second is whether individuals view their environment as favorable or unfavorable. Dominance entails feeling more powerful than one’s environment and operating within an unfavorable environment. Influence entails feeling more powerful than one’s environment and operating within a favorable environment. Steadiness entails feeling less powerful than one’s environment and operating within a favorable environment. Conscientiousness entails feeling less powerful than one’s environment and operating within an unfavorable environment. Given this dimensionality, we would expect that each dimension is related but relatively unique.
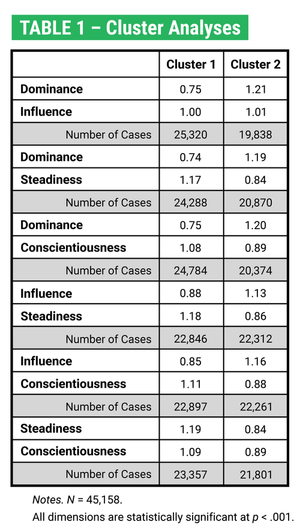
The forced-choice question approach of the assessment does not allow for the traditional factor analysis approach applied to Likert-style assessments. I, therefore, employed a cluster analysis approach to approximate the factor structure. Cluster analyses allow for an investigation of the characteristics of a specified number of profiles (i.e., clusters) within the sample data based on a specified number of dimensions (Scott & Knott, 1974). In this case, I specified two profiles based on two dimensions at a time. I did this for each possible pair (i.e., D and I, D and S, D and C, I and S, I and C, S and C). The underlying theory of DISC would suggest that the two profiles should differ such that the first profile has a higher mean score on one dimension compared to an alternative dimension, and the second profile is the inverse.
I used the mean, dimension-level score for D, I, S, and C in the cluster analyses. The findings of the cluster analyses (see Table 1) generally support a priori expectations. For example, when comparing Dominance and Influence, cluster 1 Dominance (.75) is lower than cluster 1 Influence (1.00), and cluster 2 Dominance (1.21) is higher than cluster 1 Influence (1.01). This suggests that Dominance and Influence are divergent dimensions. This expected pattern does not hold for the Steadiness and Conscientiousness comparison where the cluster scores are similar. However, each of these dimensions shows appropriate differences between the Dominance and Influence dimensions. This suggests that when users feel that they are less powerful than their environment, they might find it challenging to differentiate between their environment being favorable (Steadiness) versus unfavorable (Conscientiousness).
Test-Retest Reliability
A total of 138 users within the sample completed the DISC assessment two or more times. This allowed for investigating whether there were significant differences between the dimension scores across time. Across the 138 users, I conducted a one-sample mean difference t-test. As expected, there were no statistically significant differences for any of the four dimensions (see Table 2 below). This offers support for test-retest reliability.
Conclusion
With respect to inflation bias and social desirability responding, forced-choice measures are considered superior to Likert-style assessments (Anderson et al., 1984). The challenge, however, is that forced-choice measures offer interdependent questions within each forced-choice question block. Thus, it is necessary to impose assumptions to approximate reliability and validity testing. In this case, I created continuous variables by re-scoring questions within each question block. Using this approach I was able to evaluate the general structure of the variables and dimensions. The findings suggest that there are no problematic items and that the four-dimension factor structure is appropriate. Further, findings from our test-retest analyses suggest that DISC scores are likely to remain the same when users take the measure across time.
References
Anderson, C. D., Warner, J. L., & Spencer, C. C. (1984). Inflation bias in self-assessment examinations: Implications for valid employee selection. Journal of Applied Psychology, 69(4), 574–580
Marston, W. M. (1928/2013). Emotions of normal people. Vol. 158. Routledge.
Merenda, P. F., & Clarke, W. V. (1965). Self-description and personality measurement. Journal of Clinical Psychology, 21, 52–56.
Scott, A. J., & Knott, M. (1974). A cluster analysis method for grouping means in the analysis of variance. Biometrics, 507-512.
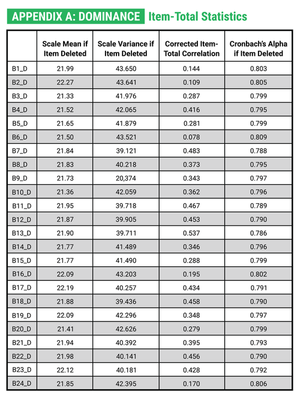
Appendix A
Dominance – Item-Total Statistics
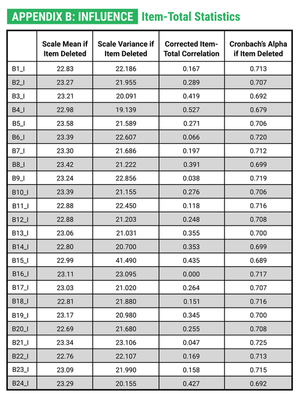
Appendix B
Influence – Item-Total Statistics
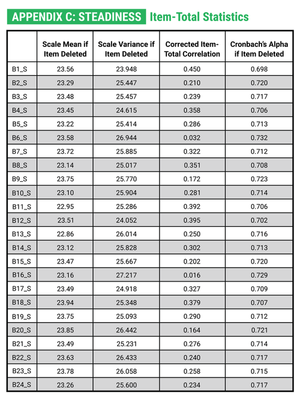
Appendix C
Steadiness – Item-Total Statistics
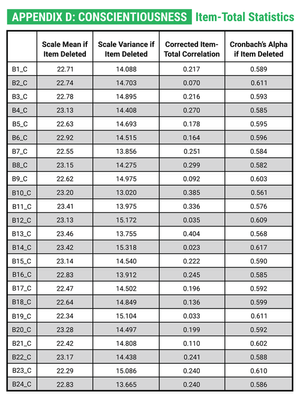
Appendix D
Conscientiousness – Item-Total Statistics
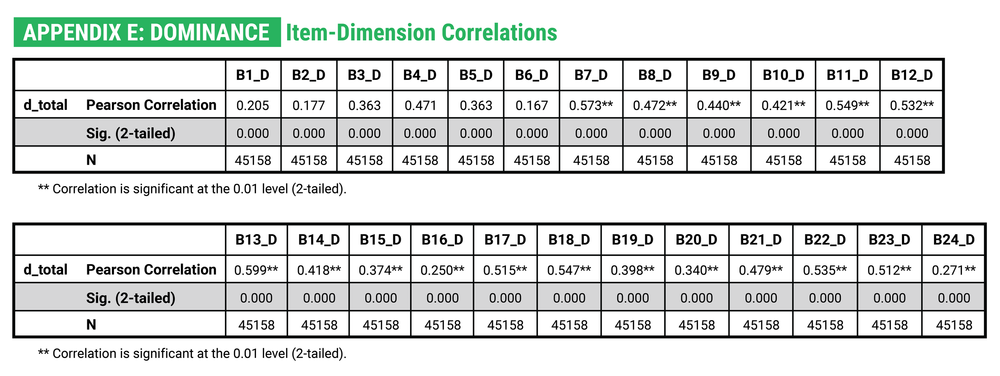
Appendix E
Dominance – Item-Dimension Correlations
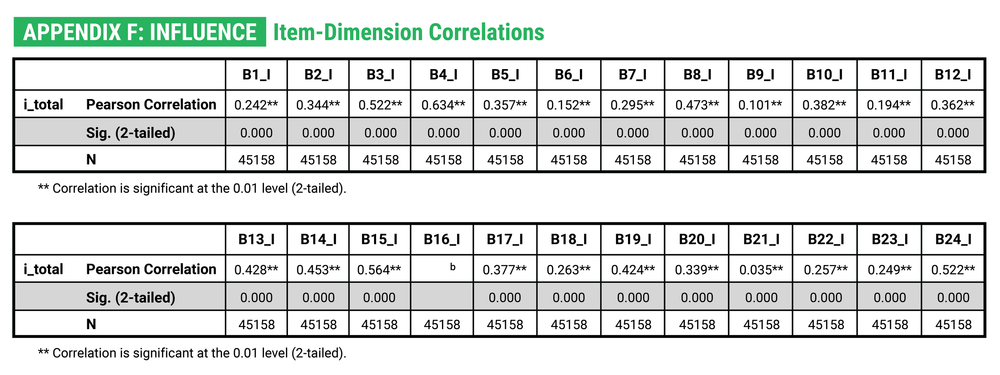
Appendix F
Influence – Item-Dimension Correlations
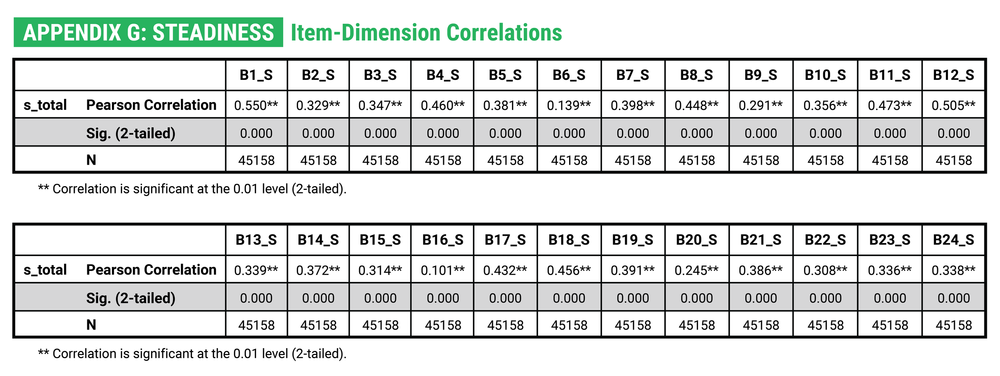
Appendix G
Influence – Item-Dimension Correlations
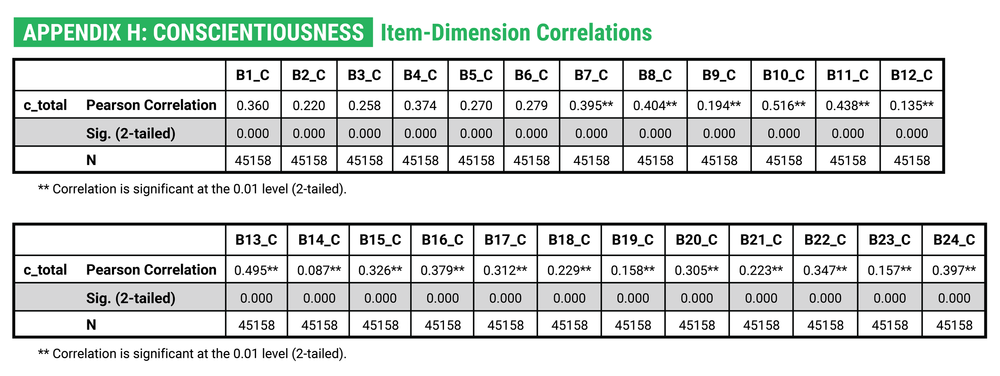
Appendix H
Conscientiousness – Item-Dimension Correlations